SCI Stable Currency Index

About EWI | Contact Us

Technical Matters


    Overview
    Background
    Technical Matters


SCI Charts

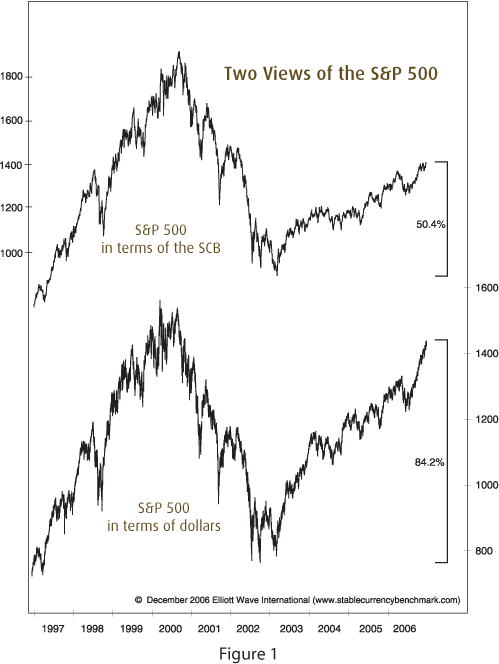
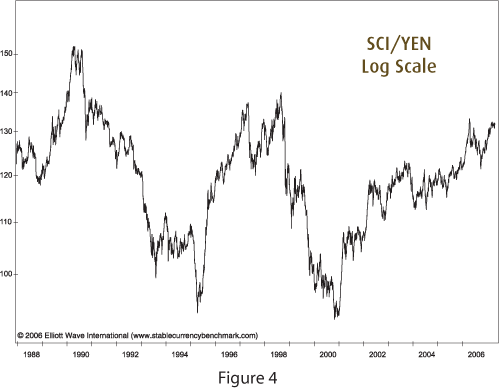
The charts below show stocks, gold and other major currencies in terms of the SCI. The first chart shows the S&P 500 valued by two measures, the SCI, and the USD. In terms of the SCI, the S&P 500 shows a 50% rise since 2002 in global value. But when viewed in terms of the declining USD, the index shows an 80% rise, a false picture of the global value of these stocks.
Stable Currency Index (SCI) / The U.S. Dollar


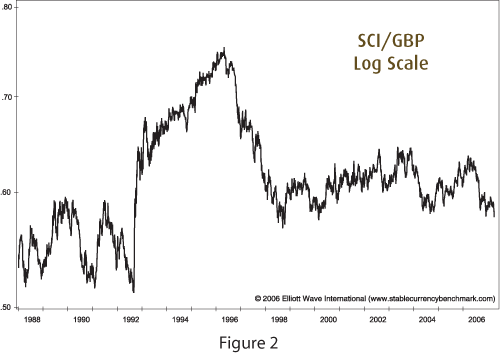
Stable Currency Index (SCI) / The British Pound


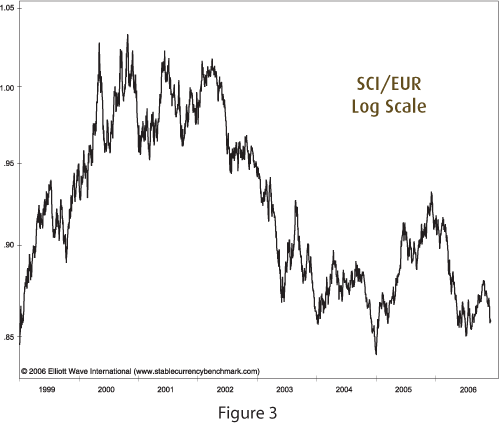
The Stable Currency Index (SCI) / The Euro


The Stable Currency Index (SCI)  / The Yen


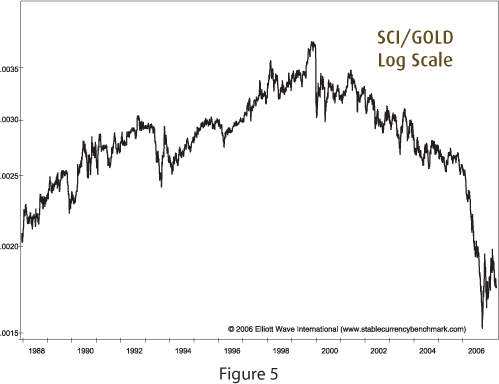
The Stable Currency Index (SCI) / Gold


Stable Currency Index